H2H7 / H2H7 Standings
-
 18-April 15
-
 wheres_walto
Offline
wheres_walto
Offline
Everything in this thread is unofficial, and is just walto playing around with numbers because it's fun. Please take the time to read through the thread and build some understanding before criticizing. Also, please report any mistakes.
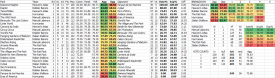
AGGREGATE PARK SCORES
The idea here is that there are multiple tools on NE that rank parks, and this is my way of aggregating them into one number. As the season progresses, it will be easy to see who the best teams and players are in terms of park quality.
COMPONENT A
- The current community score. This is the average ranking (out of 100%) calculated from every vote cast by a NE member.
COMPONENT B
- Accolade Panel score. Some parks don't currently have a usable score (Cyleal doesn't have an accolade score, and I also didn't include Raptor's score because it was judged as a design rather than a Spotlight).
COMPONENT C
- End of Round Poll score. Using Liam's polls at the end of each round, I developed a calculation (also out of 100%) to give a third ranking to parks.
- Every first place vote is worth 2 points, every second place vote is worth 1 point
- Each park's total number of points is calculated, then divided by the maximum number of points available (total votes * 2).
- Multiply by 100 (to convert to percentages), then take the square root (to lessen the gap between the best and "worst" park of each round).
- Multiply by 3.5, then add 60, and you've got each park's score. These 2 numbers are arbitrary and subject to change, but have worked pretty well so far.
- EXAMPLE: Tenochtitlan received 31 first-place votes, 12 second-place votes, there were 65 votes cast. Tenochtitlan scored 74 of a maximum 130 points. Follow the next few steps, and Tenochtitlan was found to have a poll score of 86.41%, which compares well to its community and panel scores of 83% and 81.89%
STANDINGS BREAKDOWN
With a nice, neat Aggregate Park Score, we can then cross-reference each week to see how a park might have done against any other. It's really simple: the best team from each week would presumably have been 5-0, the second-best 4-1, and so on. This is a nice way of seeing how good teams were, regardless of their strength of schedule.
Both the standings breakdown and team average aggregate score could be used as potential tie-breakers. But how do vote counts figure in to the standings? They have to count for something, right? Well... not really, no. Voting can be modeled and estimated based simply on Aggregate Park Scores. Here's how:
VOTE PERCENTAGE MODEL
This operates pretty similarly to the Pythagorean Expectation (which is a win% estimator used frequently in sports, based on team and opponent scoring). For my example, I'll use Raptor vs. Cyleal:
- The first step is to plug both Aggregate scores into the Pythagorean Expectation formula (Team A ^ 2) / (Team A ^ 2 + Team B ^ 2). Then multiply by 100 to make the numbers into percentages rather than decimals.
- Subtract 50. The resulting number is how far from 50% of the vote each park would be expected to receive, but it isn't accurate yet.
- Multiply by 3.5. This is done to amplify the effect on voting percentage observed by differences in Aggregate Park Score. In other words, 85-68 match corresponds to a much larger vote disparity than the 17 percentage point difference in park quality would indicate.
- Add 50. This returns the numbers to vote percentages. In the example of Raptor vs. Cyleal, the model estimates that Raptor would receive 87.80% of the vote, while Cyleal would receive the other 12.20%. In reality, Raptor won the vote 88% to 12%.
-
 Cocoa
Offline
Cocoa
Offline
you should also give the votes as for:against percentages, as there's gonna be a different amount of voters in every match. just for some fun statistics. You could actually have a for:against for every team that changes over the matches, like a KD ratio sort of thing.
what are some other fun statistics...hm
you could also do it on a player/builder level to see who gets the best for:against, although its always a bit off because something like PoE which is great still has low for:against ratio.
lets get some fancy excel shit going and next year we can moneyball the draft
-
 Liampie
Offline
I already moneyballedH2H matches in h2h6. Will expand the data sheet and post my findings in a few months time
Liampie
Offline
I already moneyballedH2H matches in h2h6. Will expand the data sheet and post my findings in a few months time -
 Roomie
Offline
Roomie
Offline
you should also give the votes as for:against percentages, as there's gonna be a different amount of voters in every match. just for some fun statistics. You could actually have a for:against for every team that changes over the matches, like a KD ratio sort of thing.
WEEK 1
Heaven's Atlas def. Hurricanes 74%-26%
Robber Barons def. Italian Stallions 88%-12%
Manual Laborers vs. The Rat Pack
-
wheres_walto
Offline
I love it! I used vote percentage, build percentage, and your best of each round polls in an attempt to calculate the number of wins contributed by each player. What did you do?
-
Liampie
Offline
I actually analysed match ups, not players. What type of parks tend to win? I calculated the correlation between vote percentage, finishedness, realism, genericness and maybe on other, I don't remember well. We won H2H6 so I guess the research paid off. I used H2H5 matches for data, so there's a lot more data to analyse. H2H6 had a lot of RCT2 vs. LL matches, so that's useful.
-
 Kumba
Offline
Kumba
Offline
Please consider adding something like this to the first post:
Team----------------W--L----VG----VA----Dif
Robber Barons.... 1.... 0.... 66.......9.....+57
Manual Laborors.. 1.... 0... 57.......9.... +48
Heaven's Atlas......1.... 0.... 57.....20....+37
Hurricanes............0.....1.....20.....57.....-37
-------------------Playoffs------------------------
Rat Pack.................0.....1......9......57.....-48
Italian Stallions......0.....1......9......66.....-57
VG = Votes gained
VA = Votes allowed
-
Cocoa
Offline
Thats fucked that the standings make heavens atlas the third best when they made the best park. Is there a more statistically fair way of determining playoffs than vote counts?
-
 G Force
Offline
G Force
Offline
Thats fucked that the standings make heavens atlas the third best when they made the best park. Is there a more statistically fair way of determining playoffs than vote counts?
If we just go by "best" park then the match ups would worthless. The whole reason its called H2H is because of the match ups. Plus, saying a park is the "best" is subjective, going by vote differential, or votes gained, is the only way to objectify the standings.
-
![][ntamin22%s's Photo](https://www.nedesigns.com/uploads/profile/photo-thumb-221.png?_r=1520300638) ][ntamin22
Offline
][ntamin22
Offline
although we do now have almost immediate panel ratings for parks, so panel score could potentially play into a tiebreak scenario.
-
Kumba
Offline
They made the best park.
I don't think that opinion can be any factor in standings or tiebreakers. I think it's the vote % that will break a tie.
-
Cocoa
Offline
The poll that liam set up clearly indicated h.a. had best park, no? I wasnt just saying my opinion.
-
Cocoa
Offline
And the real issue is the voting differential, way more people voted on that matchup so just a plain vote tally won't give a fair result. Percent would be more valid imo

 what did you do?

Tags
- No Tags